Overview
The FHA MIP chart for 2024 is crucial for families seeking to save on mortgage costs. It outlines the insurance premiums required for FHA financing and highlights potential savings through reduced rates. Understanding this chart can empower families to evaluate their monthly expenses effectively. By doing so, they can make informed financial decisions, ultimately leading to significant savings over the life of their loans. We know how challenging navigating mortgage costs can be, and we’re here to support you every step of the way.
Introduction
Navigating the complexities of home financing can feel overwhelming, especially for families eager to secure their dream homes through FHA loans. We understand how challenging this can be. The FHA MIP chart for 2024 serves as a crucial resource, illuminating the insurance premiums tied to these loans. These premiums can significantly impact monthly budgets and overall affordability.
As families explore this vital tool, they may encounter confusion and misconceptions that could hinder their financial decisions. We’re here to support you every step of the way. By understanding the nuances of the FHA MIP chart, families can empower themselves to maximize their savings and confidently navigate the home-buying process. How can this knowledge transform your journey towards homeownership?
Explore the FHA MIP Chart: Importance and Overview
The fha mip chart 2024 serves as an invaluable resource for families seeking to secure their homes through FHA financing. This option is particularly appealing due to its minimal upfront cost criteria. The chart outlines the insurance premiums borrowers must pay, providing essential protection for lenders against defaults. Understanding the fha mip chart 2024 is crucial, as it enables families to accurately evaluate their monthly expenses and overall borrowing costs.
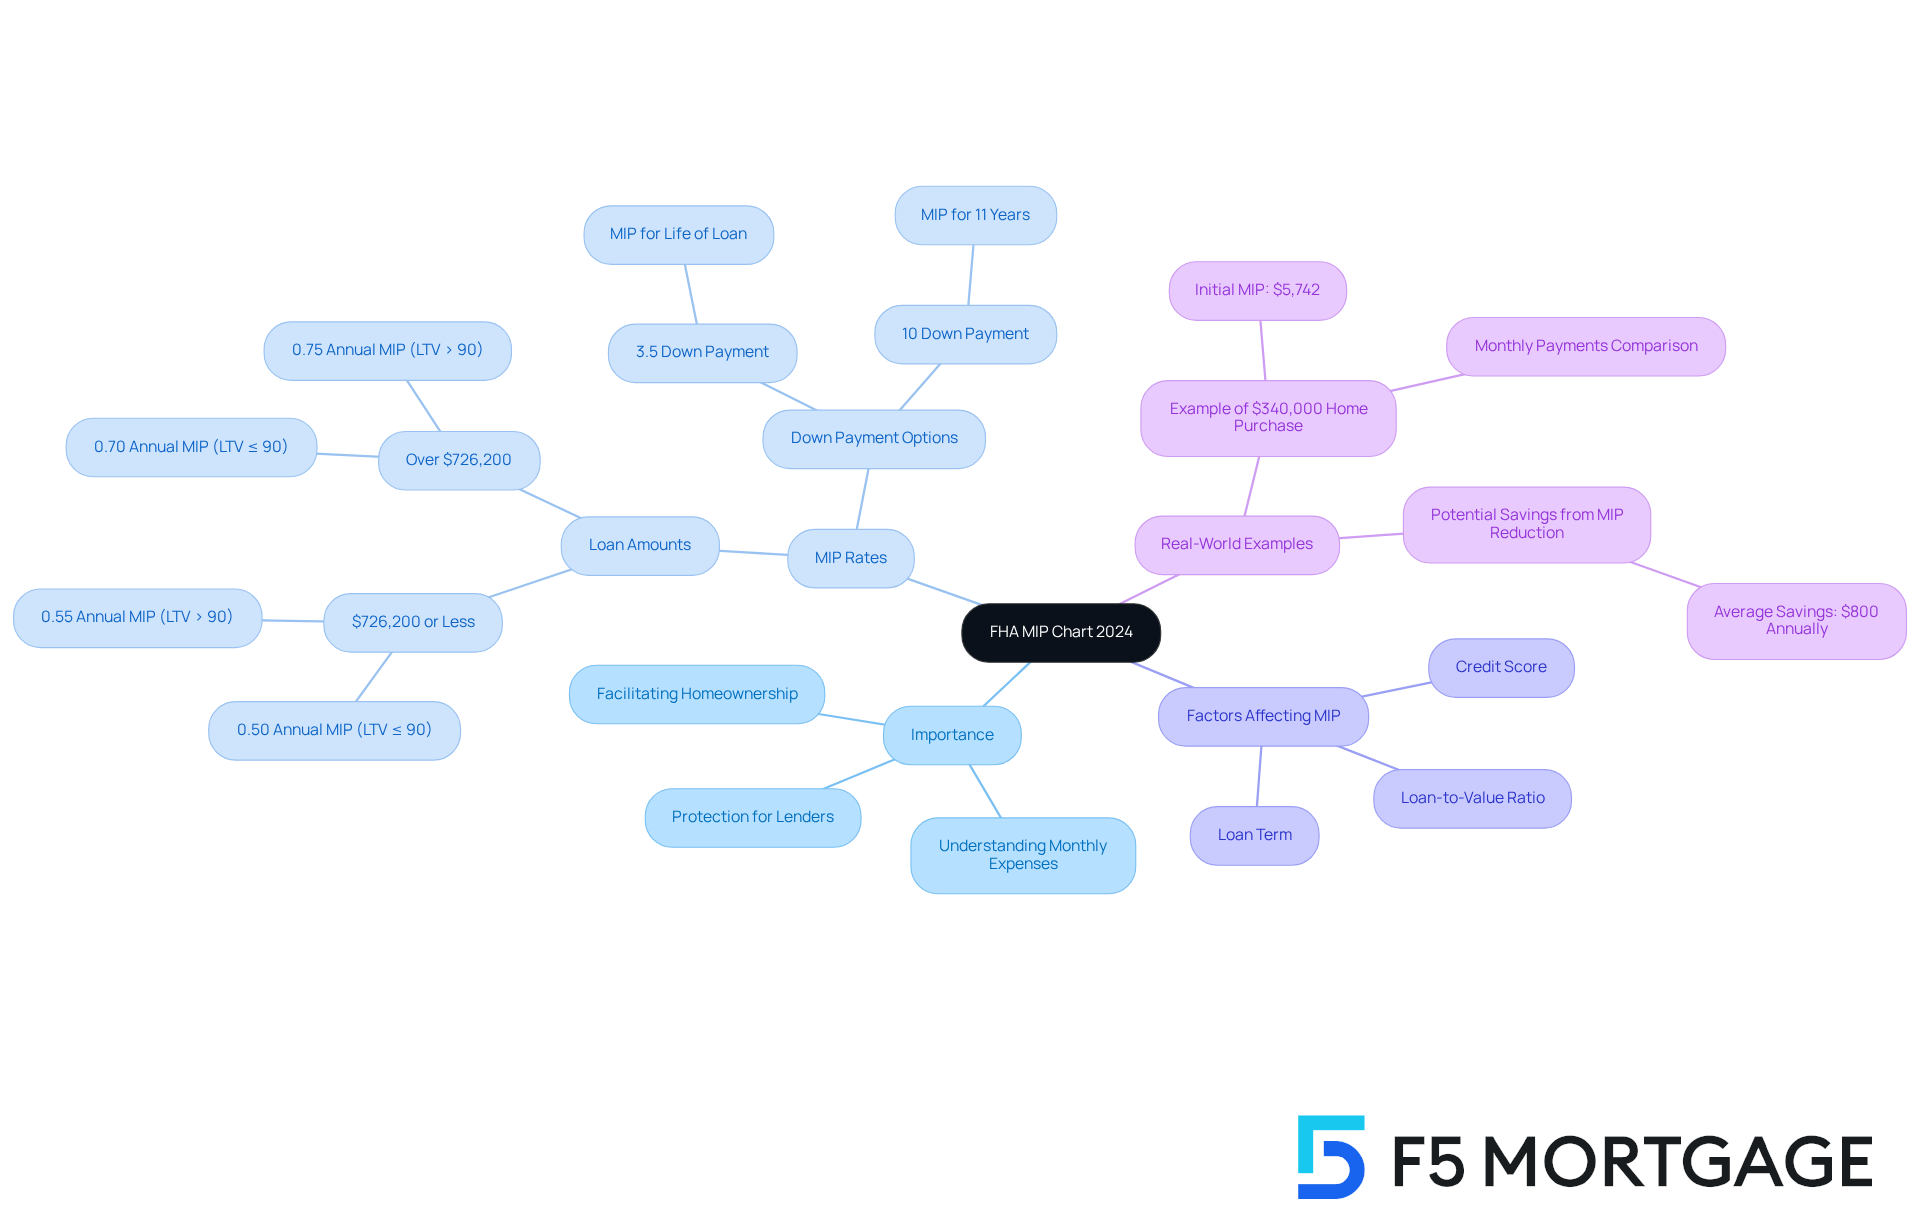
As we look ahead to 2025, it’s important to note that FHA MIP rates vary based on several factors, including the amount borrowed, loan term, and down payment. For mortgages of $726,200 or less with a loan-to-value (LTV) ratio of 90% or below, the annual MIP rate stands at 0.50%. Families making a down payment of 3.5% typically pay MIP for the life of the mortgage, while those who can provide a down payment of 10% or more will only need MIP for 11 years.
Real-world examples can truly illustrate the potential savings families can achieve by utilizing the fha mip chart 2024. For instance, a household purchasing a home for $340,000 with a 3.5% down payment may encounter an initial MIP of around $5,742, along with monthly payments that could be significantly lower than those associated with traditional financing. With the recent reduction in MIP rates effective March 20, 2023, many families could save over $800 each year, making homeownership more attainable.
Experts emphasize the importance of mastering the fha mip chart 2024. Financial consultants highlight that understanding these premiums can enable families to make informed decisions about their mortgage options, ultimately leading to substantial savings over the life of the loan. By leveraging the fha mip chart 2024, families can navigate the complexities of home financing with greater confidence and clarity. We know how challenging this can be, and we’re here to support you every step of the way.

Understand FHA Mortgage Insurance Premiums: Components and Impact
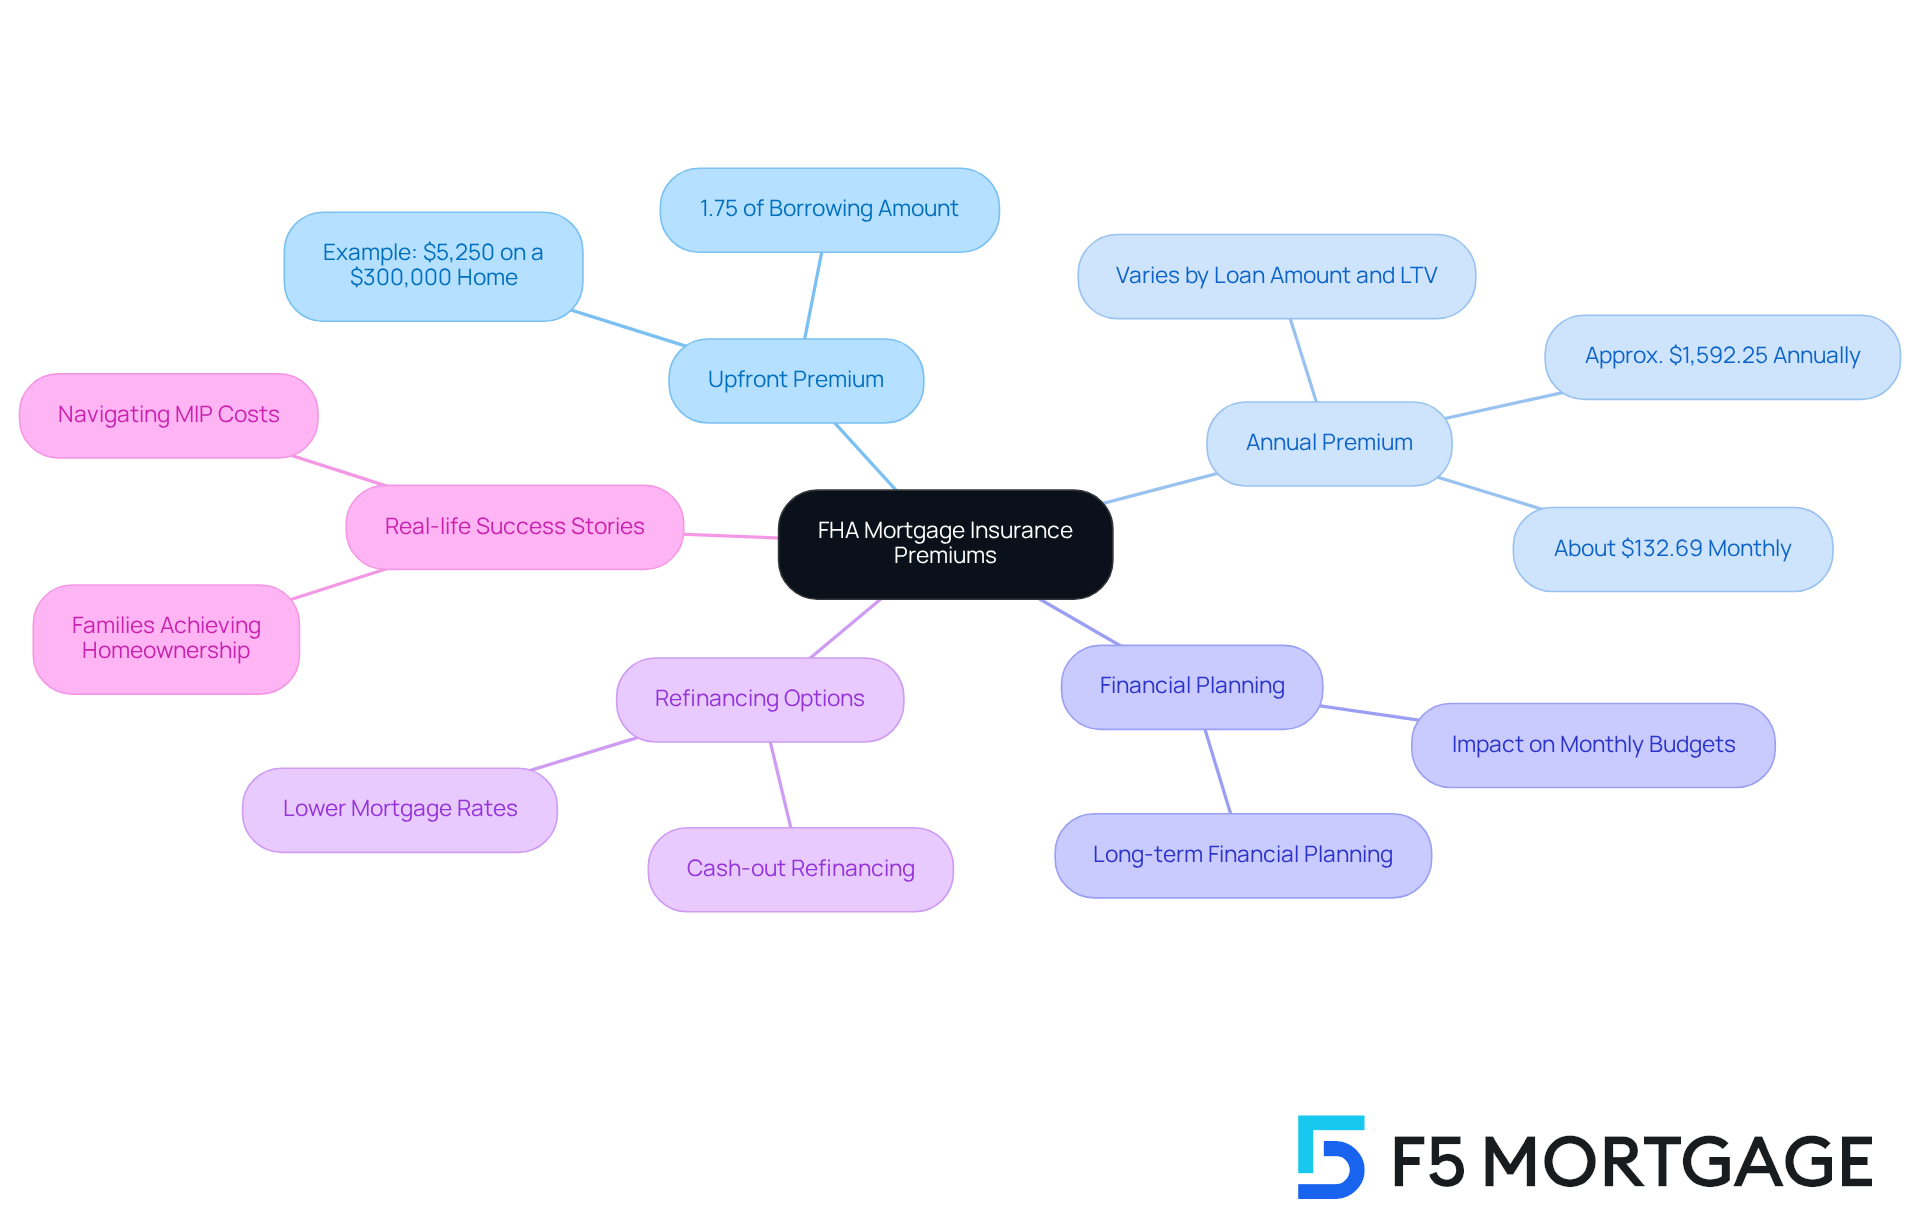
FHA Mortgage Insurance Premiums (MIP) consist of two key components: the upfront premium and the annual premium. The upfront premium is set at 1.75% of the borrowing amount, and it can be included in the mortgage, making it more manageable for families. The annual premium, paid monthly, varies based on the loan amount and the loan-to-value (LTV) ratio; typically, a smaller initial contribution leads to a higher annual premium. For instance, on a $300,000 home with a 3.5% down payment, the upfront premium would be approximately $5,250, while the annual premium could be around $1,592.25, translating to about $132.69 each month.
Understanding these components is crucial for families, as they significantly impact mortgage affordability according to the FHA MIP chart 2024. We know how challenging this can be, and financial advisors stress that the cumulative effect of these premiums can influence monthly budgets and long-term financial planning. For example, families who manage their down payments wisely and explore refinancing options may find ways to reduce or eliminate MIP costs over time. In California, cash-out refinancing can be an effective strategy, enabling families to tap into their home equity for important expenses like renovations or debt consolidation. Similarly, in Colorado, families can take advantage of lower mortgage rates to refinance and potentially decrease their MIP costs.
Real-life stories illustrate how families have successfully navigated these premiums, achieving homeownership while maintaining financial stability. By understanding how the FHA MIP chart 2024 works alongside refinancing options, families can make informed decisions about their financing strategies and budget effectively for their mortgage journey. We’re here to support you every step of the way as you embark on this important financial path.

Utilize the FHA MIP Chart: Step-by-Step Calculation Guide
Navigating the fha mip chart 2024 can feel overwhelming, but we are here to support you every step of the way. By following these simple steps, you can gain clarity on your mortgage expenses and plan your budget more effectively.
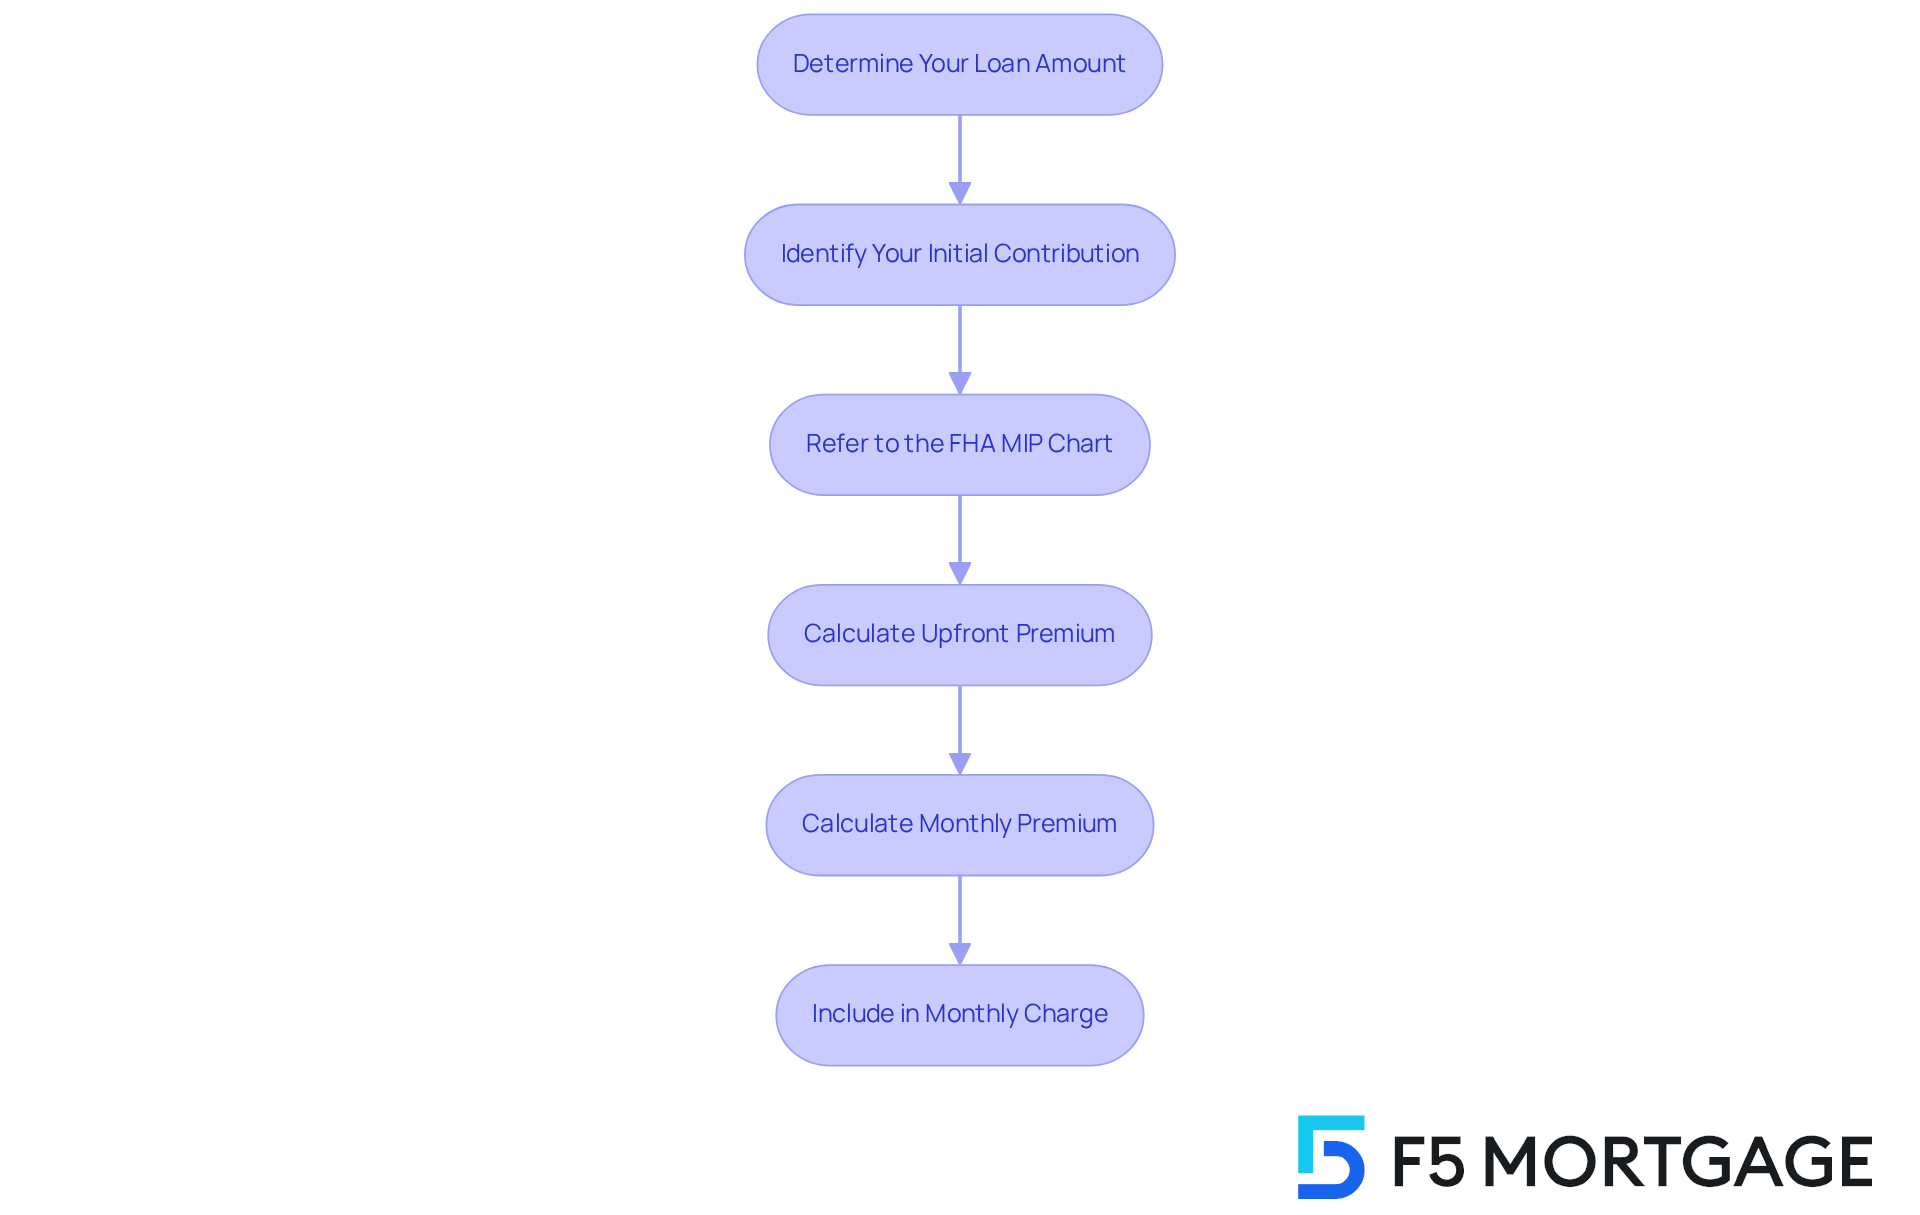
- Determine Your Loan Amount: Begin by identifying the total amount you plan to borrow. This is the foundation for your calculations and an essential first step in your journey.
- Identify Your Initial Contribution: Next, calculate the percentage of your initial contribution. Understanding this will significantly influence your MIP rates and help you make informed decisions.
- Refer to the FHA MIP Chart: Locate the relevant section of the chart that corresponds to your financing amount and down payment percentage. This will guide you in understanding your costs.
- Calculate Upfront Premium: To determine the upfront premium, multiply your borrowing amount by 1.75%. For instance, if you plan to borrow $300,000, the upfront premium would be $5,250.
- Calculate Monthly Premium: Use the chart to find the yearly premium rate based on your borrowing amount and deposit. Dividing this figure by 12 will give you your monthly MIP, making it easier to budget.
- Include in Monthly Charge: Finally, integrate the monthly MIP into your estimated principal and interest costs. This will provide you with a comprehensive view of your total monthly mortgage expense.
By following these steps, you can achieve a clearer understanding of your mortgage expenses, allowing you to plan your finances with confidence.

Clarify Common Misconceptions: FAQs About FHA MIP
For many potential borrowers, navigating the world of FHA Mortgage Insurance Premiums (MIP) can be confusing, especially when referencing the FHA MIP chart 2024. We understand how overwhelming this can feel, so let’s clarify some common misconceptions that may be causing concern.
-
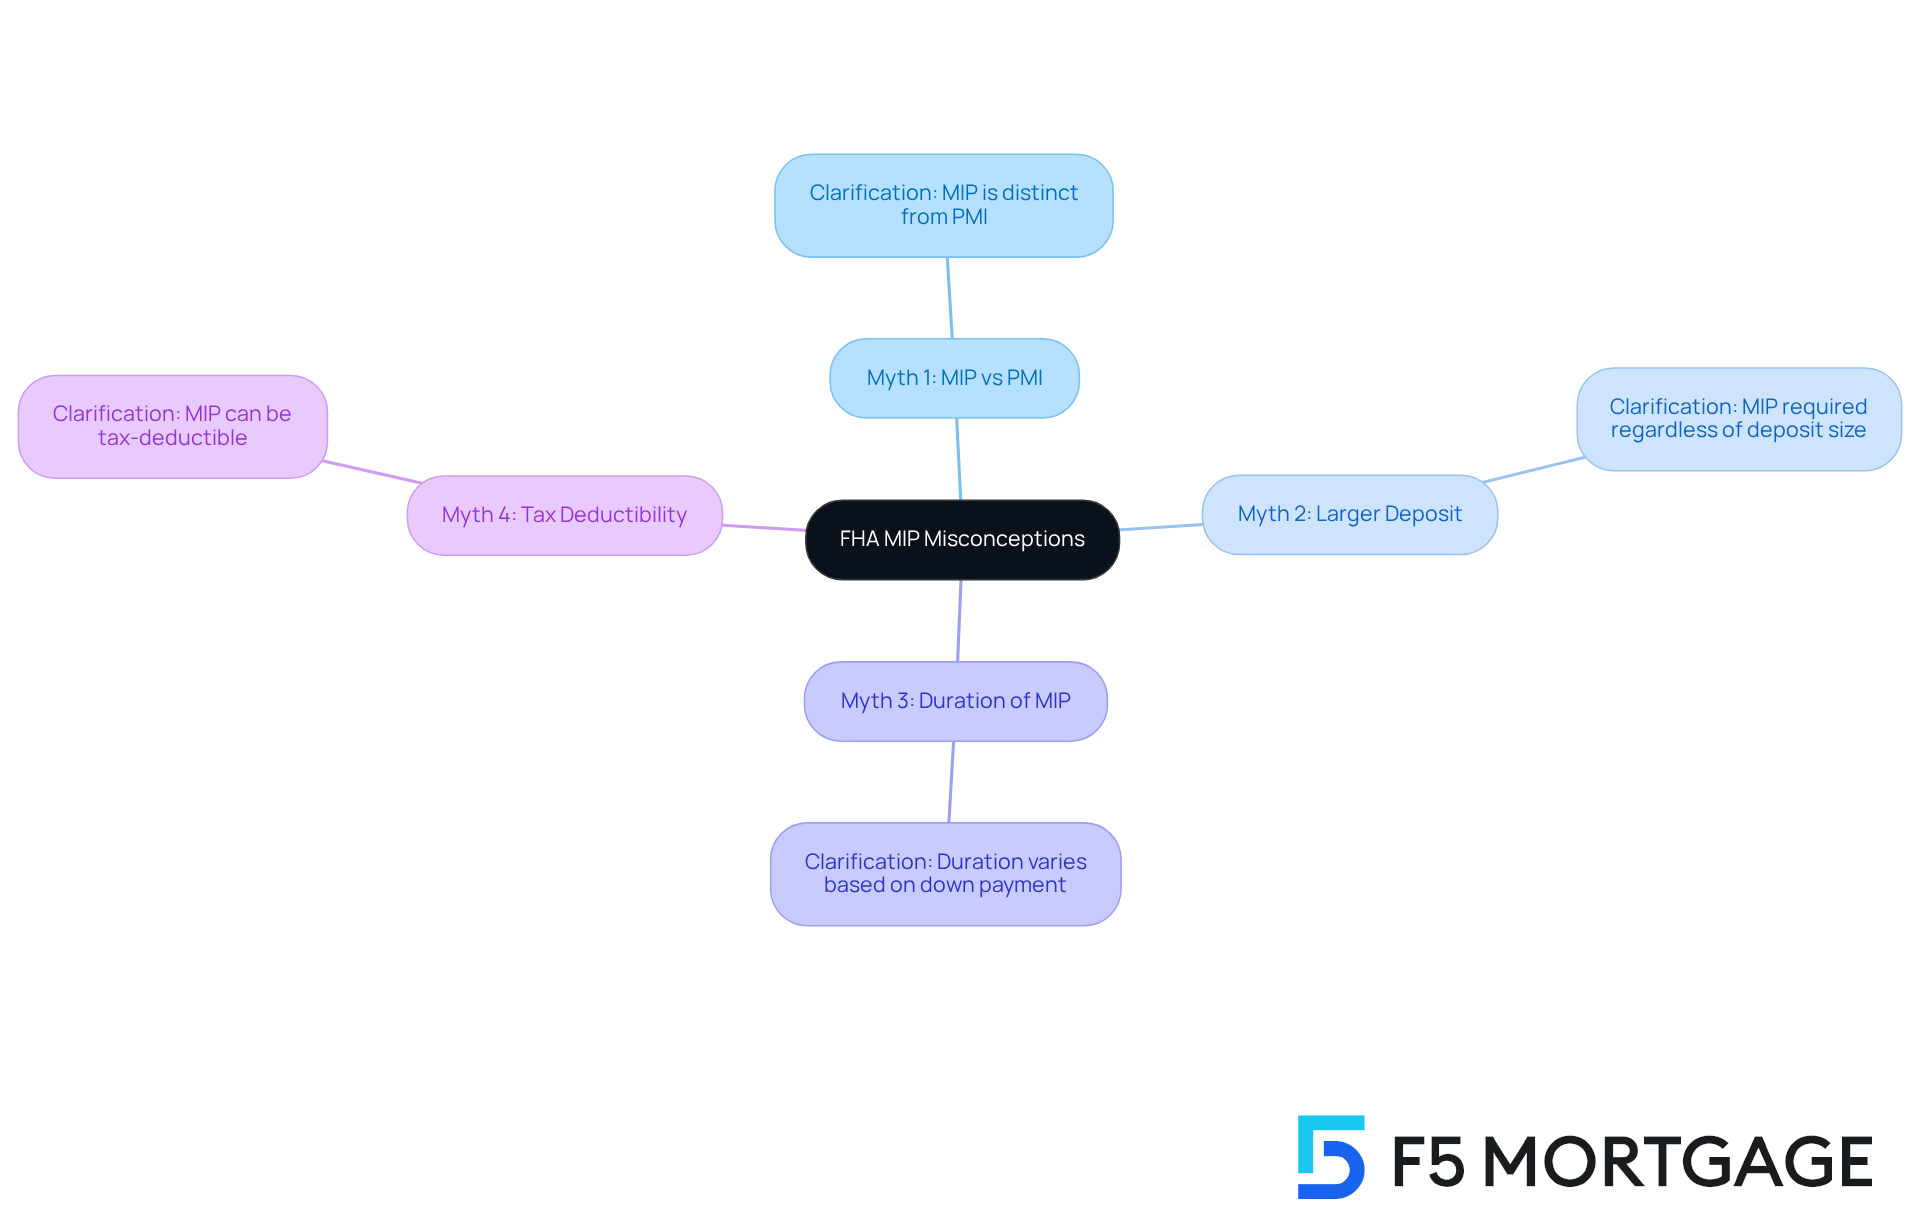
Myth: FHA MIP is the same as private mortgage insurance (PMI): While both MIP and PMI serve to protect lenders, they are distinct. The FHA MIP chart 2024 is specifically linked to FHA mortgages and features different rates and requirements. It’s crucial for borrowers to understand these differences to make informed decisions.
-
Myth: You can avoid FHA MIP with a larger deposit: Unlike traditional financing options, which may allow for the cancellation of PMI with a significant deposit, FHA mortgages require MIP regardless of the deposit size. If your initial contribution is below 10%, MIP will be necessary for the entire duration of the financing. This means that even with a larger initial contribution, borrowers will still face expenses related to the FHA MIP chart 2024.
-
Myth: FHA MIP lasts for the life of the mortgage: The duration of MIP contributions can vary based on the mortgage’s origination date and the down payment amount. For example, according to the FHA MIP chart 2024, if a borrower puts down at least 10%, MIP is only required for 11 years on FHA loans. However, a smaller down payment may necessitate MIP for the entire loan term.
-
Myth: FHA MIP is not tax-deductible: Contrary to some beliefs, FHA MIP can often be deducted on federal tax returns, similar to PMI. This provides potential tax benefits for homeowners, which can be a relief.
By clarifying these misconceptions, we hope to empower families to navigate their mortgage options with enhanced confidence and clarity. Remember, we’re here to support you every step of the way, helping you make better financial decisions.

Conclusion
Understanding the FHA MIP chart 2024 is crucial for families seeking to navigate the complexities of home financing. We know how challenging this can be, but by mastering this chart, you can make informed decisions about your mortgage options. This leads to significant savings and a clearer financial outlook. The insights provided not only clarify the FHA mortgage insurance premiums but also empower you to take control of your homeownership journey.
Throughout this article, we’ve highlighted key points, including:
- The breakdown of FHA MIP components
- The step-by-step calculation process
- Common misconceptions surrounding FHA MIP
Real-world examples show how families can save money through informed choices. Plus, with the recent reduction in MIP rates, it’s more important than ever to stay updated on these changes. By leveraging the FHA MIP chart 2024, you can accurately assess your monthly expenses and overall borrowing costs, ensuring you are well-prepared for homeownership.
In conclusion, the significance of the FHA MIP chart goes beyond mere numbers; it represents a pathway to financial stability and homeownership for many families. By taking the time to understand and utilize this resource, you can unlock substantial savings and make empowered decisions about your future. The journey to homeownership may be challenging, but with the right knowledge and support, you can navigate it with confidence and clarity.
Frequently Asked Questions
What is the FHA MIP chart 2024?
The FHA MIP chart 2024 is a resource that outlines the mortgage insurance premiums that borrowers must pay when securing FHA financing. It helps families evaluate their monthly expenses and overall borrowing costs.
Why is the FHA MIP chart important for families?
It is important because it allows families to understand the costs associated with FHA loans, which can aid in making informed decisions about their mortgage options and potentially lead to substantial savings.
How do FHA MIP rates vary?
FHA MIP rates vary based on several factors, including the amount borrowed, loan term, and down payment. For loans of $726,200 or less with an LTV ratio of 90% or below, the annual MIP rate is 0.50%.
What are the MIP requirements based on down payment amounts?
Families making a down payment of 3.5% typically pay MIP for the life of the mortgage, while those who provide a down payment of 10% or more will only need to pay MIP for 11 years.
Can you provide an example of potential savings using the FHA MIP chart?
For instance, a household purchasing a home for $340,000 with a 3.5% down payment may face an initial MIP of around $5,742, with monthly payments significantly lower than those associated with traditional financing.
How have recent changes affected MIP rates?
A reduction in MIP rates effective March 20, 2023, allows many families to save over $800 each year, making homeownership more attainable.
What do experts say about understanding the FHA MIP chart?
Experts emphasize that mastering the FHA MIP chart can empower families to make informed mortgage decisions, leading to significant savings over the life of the loan.


